

BacKGROUND
This project began in January 2016 in response to a large number of calls Massport had received regarding the noise levels of planes arriving and departing from Logan Airport. Noise from airplanes flying overhead has long been a concern for communities living near major airports and along major flight paths. Within the past year, however, complaints regarding airplane noise within metropolitan Boston MA have increased dramatically, given Logan International Airport’s (Logan) recent change to narrower flight paths in order to increase fuel and airport efficiency.
Several recent epidemiological studies have shown increased cardiovascular hospitalizations, development of cognitive impairments, sleep disturbances and hearing loss among susceptible individuals who are consistently exposed to aircraft noise (Hansell, 2013; Stanfield, 2015). However, It is not known, whether MA residents are at an increased risk of developing these adverse cognitive and physiological effects from noise associated with the change in flight paths, given the lack of noise measurements in the newly affected communities. The purpose of this website is to provide census pertinent information on noise levels surrounding Boston Logan Airport as modeled by Massport. This will enhance community understanding and provide information to improve engagement and discussions regarding noise mitigation.
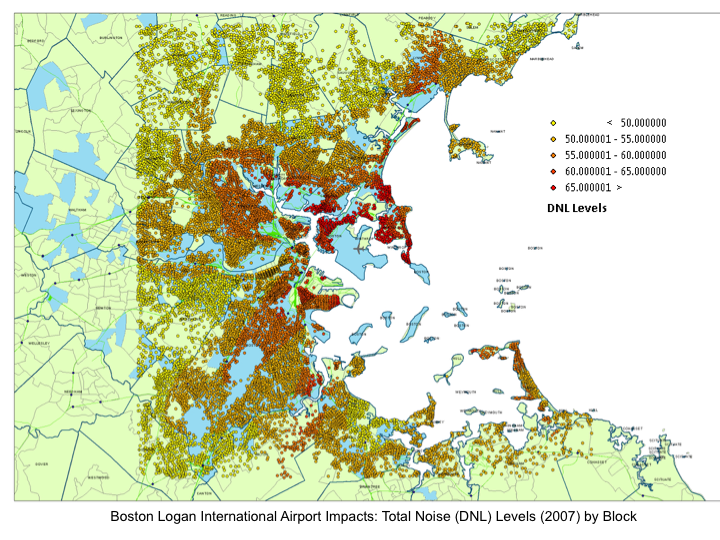
Boston - Logan International Airport Environmental Data Report (EDR) provides pertinent yearly information on airport operations, noise abatement and metrics, and air quality. Noise abatement policies are controlled via 35 listening stations collect data on Day night average sound levels (DNL) which Massport uses to monitor flight paths and minimize airport impacts on surrounding communities. Integrated Noise Modeling (INM) is used to discriminate airplane noise from surrounding traffic, generate geographic noise contours, and as a criteria for sound proofing. Criteria for Massport funding soundproofing, particularly in East Boston and neighborhoods with high noise levels adjacent to the airport is based on FAA regulations: “Annual noise of 65 DNL or greater is a level the FAA has established as incompatible with residential communities.” (MassPort, 2016)

Boston Logan Airport Noise Pollution and Census Indicators Using Geographical Information Systems (GIS)
GIS is a system designed to capture, store, manipulate, analyze, manage, and present spatial or geographical data.

Noise Measurements [DNL] by Block Group [2007-2014]
Census Demographics
[Median Household Income, Median House Value, Race]
Boston Metro
Area Geography
Logan Airport Interactive Noise Map


Logan Airport Impacts Noise Mapping
TELL YOUR STORY
I'm a paragraph. Click here to add your own text and edit me. Let your users get to know you.
Boston Logan Airport Race by Block (2010)

Total Noise Levels (DNL) by Race and Block Group (2010-2014)

Total Noise Levels (DNL) by Median Household Income and Block Group (2010-2014)

Total Noise Levels (DNL) by Median House Value and Block Group (2010-2014)

I'm a paragraph. Click here to add your own text and edit me. Let your users get to know you.